Observability with Grafana Cloud
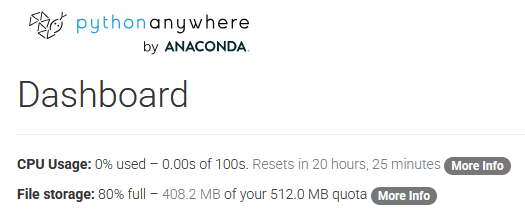
After deploying NBAGrid to pythonanywhere.com the first few users dropped in to check the game out. As the first version of the game had no rankings I didn’t even know how many were playing. The free tier of PythonAnywhere provided me with some CPU usage and memory, but without any insights I had no feel about the needed resources and how well it would scale. This line about CPU consumption was all I got:

To change this I turned my head onto Grafana, a service I’m using for several years now and which, due to its flexible architecture, fits almost every usecase when it comes to observability. This time I went with Grafana Cloud on grafana.com, which offers a free tier for small deployments. For my small game it fits very well.
The onboarding was pretty nice. In comparison to earlier versions there’s a wizard-like experience now that leads the user through all the important parts. There’s even a built-in version of Prometheus (I guess it’s rather Grafana Mimir) that allows to set up a datasource right within Grafana.com.
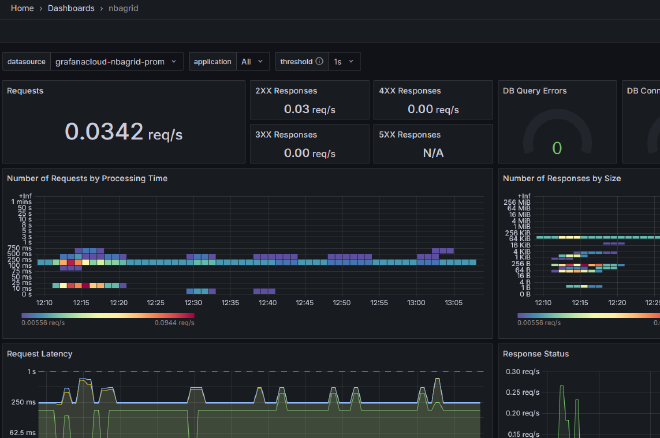
Speaking of data: Adding Prometheus data to Django was a breeze. The django-prometheus module already adds a number of series automatically that can be used to check on performance metrics, HTTP requests and database access. The public Django dashboard helps to visualize all the data in a very helpful way:

Adding my own data was quickly done as well, thanks to the Prometheus client module:
from prometheus_client import Counter, Histogram, Gauge

game_completions_counter = Counter(
    'nbagrid_game_completions_total',
    'Number of completed games',
    ['result']  # 'win', 'lose'
)

game_starts_counter = Counter(
    'nbagrid_game_starts_total',
    'Number of started games'
)
Gamewise I’m mainly interested in the user count and how many games have been played. Later on I’m planning to build on this so I can use metrics like correct guesses or picked players to tune the game filters in order to provide a better experience to users.
Regarding the Pythonanywhere computation resources I implemented a call to their API along with another dashboard and some alerting with Email notifications. This already helped me in finding a disabled service due to the MySQL database not being set up correctly.
Now I know what’s going on within the deployment and gamewise. Knowing that an alert will trigger whenever something blows up makes thinking about new users a lot less stressing. I’m looking forward building on top as well, it’s easy to think of many interesting data points that could be used.